Introduction
I’m always a big fan of approaches that get across a topic in a graphical, easy to understand way. This makes it easier for people to gain a grasp of a topic in a brief period of time, particularly those who are not experts. The UN Sustainable Development Goals are one example. Another example, and what we will concentrate on in the post, is that of Planetary Boundaries (PB).
Background
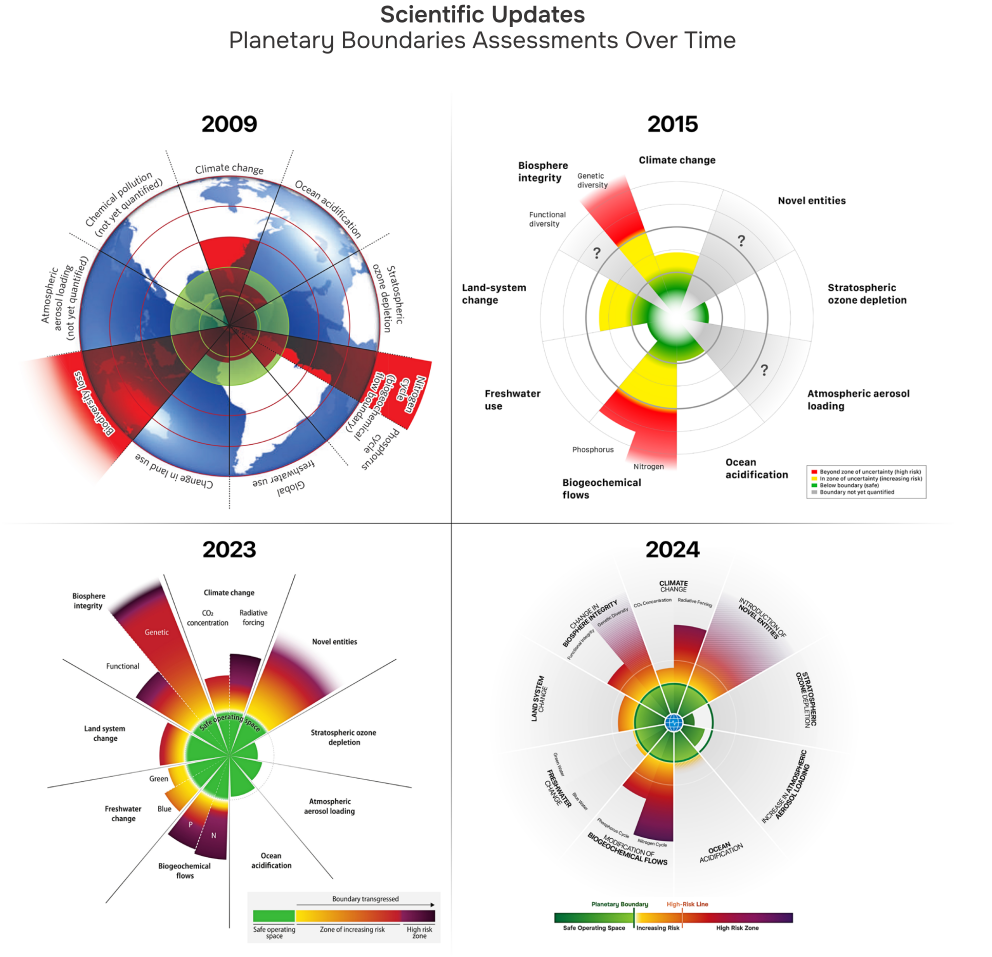
The PB model was first developed by Johan Rockström (then of the Stockholm Resilience Centre, now of the Potsdam Institute for Climate Impact Research) and a team of scientists in 2009. The concept has undergone three applications in 2009, 2015 and 2023. However, from September 2024 a yearly update to the framework will be produced (known as the Planetary Health Check).
The model
PB is an approach to determining the environmental health of the planet by concentrating on nine key PB indicators namely climate change, change in biosphere integrity, land system change, freshwater change, modification of biogeochemical flows, ocean acidification, increase in atmospheric aerosol loading, stratospheric ozone depletion and introduction of novel entities. These are depicted on a diagram as we can see in the picture below:
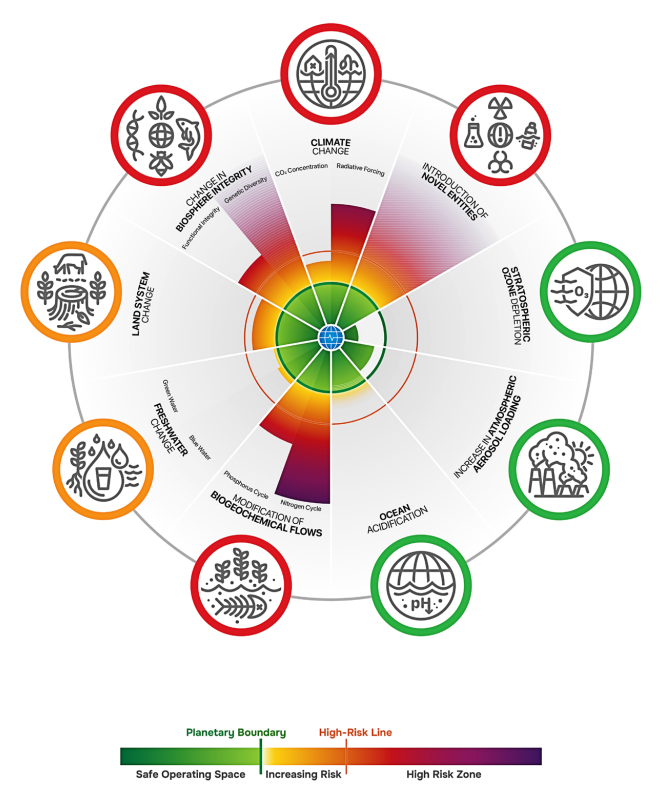
The diagram is taken from the report at https://www.planetaryhealthcheck.org/
The PB model is based on research from numerous quality scientific studies that are related to each PB indicator. For example for climate change a key data source is from the NOAA global CO2 Monitoring Programme. Each data source used is stated in Planetary Health Check Reports.
It is good to measure something but pointless unless you know what that figure means. So, the PB model consists of various zones for each of the PB indicators. These are Safe Operating Space, Zone of increasing Risk and High Risk Zone. Different colours are used to represent these zones on the PB diagram. For some of the indicators there is uncertainty due to factors such as not being quantitatively defined, current value is uncertain or safe conditions may have to revaluated due to greater scientific understanding so where this applies the edge of the indicator in the PB diagram have been blurred.
It is beyond this blog post to go into what all the PB indicators mean but they are key indicators of planetary health. It is like having a health assessment where key indicators of human health might include checking blood pressure, body weight and eyesight etc. From measuring such indicators, we can get an idea of the overall health of the planet.
Adding Social Issues
By putting social issues at the core of the diagram and tracking those, known as the ‘doughnut model’ we can gain an appreciation of how well the world is doing with regards to social issues as well as environmental issues. Almost becoming a sustainability model.
The diagram is taken from the report at https://www.planetaryhealthcheck.org/
Planetary health Check Latest
As of writing the latest health check in 2024 six of the PBs are in the high risk zone so they have breached their safe levels. These are climate change, changes in biosphere integrity, land system change, freshwater change, modification of biogeochemical flows and introduction of novel entities.
Final Note
I really like this approach because it provides a clear visualisation of the impact that we are having on our planet. It is therefore useful to environmental practitioners to get across to others, particularly those who are not subject experts or are beginning their sustainability journey, how we are impacting the planet in an easy to understand way. Yet, the data for the model is backed up by quality scientific study and research. The model has improved massively since its introduction in 2009, as you can see the knowledge gaps that were present in 2009 are no longer present in 2024. It surely will improve further as the years progress.

John Binns BSc (Hons) MSc MISEP (formerly IEMA) is an experienced environmental tutor and consultant.