
Introduction
On the 10th October 2024 the latest version of the Living Planet Index (LPI)Report was released. This is an extremely useful publication for environmental practitioners so I thought it might be worthwhile writing a blog post on it.
What is the LPI?
In a nutshell or TLDR! The LPI is a measure of worldwide biodiversity. Think of it as a detailed measure of the health of nature and you will not be far wrong.
In more detail
The LPI does this , not by tracking every species on earth, but by considering the health of 35,000 populations of vertebrates (animals that have a backbone such as birds, fish, reptiles and amphibians) representing 5,495 species. The data used to develop the LPI comes from numerous sources such as scientific journals, online databases and government reports.
The LPI assists in understanding changes in nature by tracking the size of these animal populations and how they are changing. The LPI has been operational since 1970, data on changes since then are therefore available.
Also the LPI measures something called relative abundance which means that how common or rare a species is determined by comparing to the numbers of other living things in an area where they exist, rather than the individual numbers of each species. The global index incorporates changes in ecosystems on land, freshwater and the marine environments.
Latest Results
2024 provides information for the period from 1970 to 2020. Figures in this diagram are reported as being compared to the index value of 1, which is global ecosystem health in 1970 when the first study was reported. As you can see from the figure below there has been a 73% reduction since 1970.
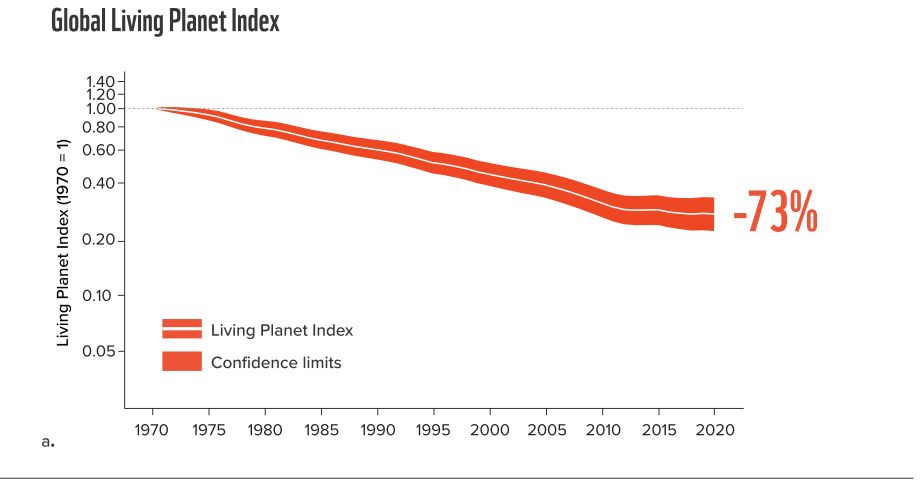
NOTE: the above diagram is taken from the report at https://livingplanet.panda.org/en-GB/living-planet-report-2024-key-messages/
The data in the report is broken down further to cover changes in each of the three ecosystems that make up the overall LPI figure. The statistics for 1970 to 2020 make grim reading:
- Marine – 56% reduction
- Terrestrial (land based) – 69% reduction, and
- Freshwater – 85% reduction.
Of particular interest is the figures for the freshwater index. This is postulated as being as a result of alterations to freshwater habitats for example the blocking of migration routes for fish.
The report goes further by breaking down the LPI results by global geographical regions, the results being (again from 1970 to 2020):
- North America – 39% reduction
- Latin America and the Caribbean – 95% reduction
- Europe and Central Asia 35% reduction
- Asia and the Pacific – 60% reduction, and
- Africa – 76% reduction.
The most notable declines, as we can see, are in Latin America and the Caribbean, Asia and the Pacific and Africa. However, as the report explains, this does not tell the full story. Countries in Europe and Central Asia and North America have a great draw on nature. This results from the massive amounts of resources they consume and the large amount of pollution and waste they create. They have basically offshored the damage to the natural world to these less developed and productive regions.
The report states that the key reasons for the loss in biodiversity since 1970 is as a result of the following factors:
- Habitat loss/degradation
- Overexploitation
- Climate change
- Pollution, invasive species/genes, and
- Disease.
Final Note
The LPI gives an excellent easy to understand overview about how humans are impacting biodiversity, particularly the global living plant index figure that shows a drop of 73% from 1970 to 2020.
It provides useful information to start a discussion on the topic in training courses or discussion on how to mitigate these issues in organisations. Drilling down into the report also provides the context for the statistics. All in all, a more than worthwhile read to help understand this vital sustainability topic.

John Binns BSc (Hons) MSc MISEP (formerly IEMA) is an experienced environmental tutor and consultant.